notes
Monitoring
Philosophy
Goals
- Alerting
- Troubleshooting
- Capacity Planning
- Prioritization
- calculate error budget and determine where to focus effort: new features or reliability.
- Business Analysis
- Experiments - compare before and after
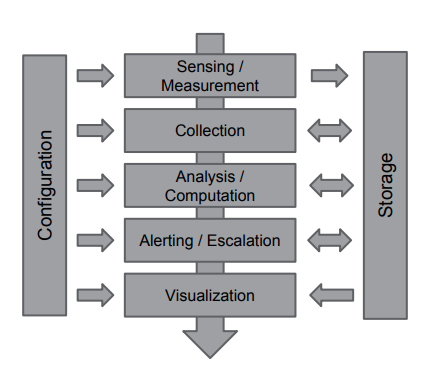
Common Scheme

Anti-Patterns
- Tool Obsession
- Not base your decisions on tools you have
- Try to have the minimal amount of tools to fullfil your needs, at it simplifies the system. But at the same time don’t be afraid of introducing a new tool, if it brings a benefits. The general rule is: if a need can be fulfilled with a tool which you already use - reuse this tool, other way introduce a new one
- Monitoring-as-a-Job
- it’s good to have observability team, which goal is to build monitoring infrastructure that developer teams will use
- observability team should not setup metrics and alerts, because this team does not now the application insight
- developer teams should use the monitoring tools provided by observability team to setup alerts and monitoring
- Checkbox Monitoring - having a monitoring just to say that you have it
- you record system load, CPU usage, memory utilization but when your service is down you don’t know why.
- you ignore alerts
- you are checking system for metrics every five minutes or even less
- you aren’t storing historical metric data
- OS metrics are not useful for alerting
- Using Monitoring as a Crutch
- Monitoring should be the only one solution for poorly built app problem. In addition to monitoring it’s good to improve app itself.
- Monitoring doesn’t fix broken things, so don’t forget to fix issue found with monitoring.
- Manual configuration
- Adding services / servers to the monitoring should be automated. Otherwise it takes from you unnecessary amount of time, it also complicates and slows down the monitoring process. Like if a developer needs to spend an hour trying to add server to monitoring - he will likely ignore it, on the other hand if it takes just a few minutes - he will do it.
- If you have a runbook (readme) with a list of manual steps to make something work, consider automating this list of steps.
Design Patterns
- Composable monitoring - use multiple specialized tools and couple them loosely together.
- Collect data (pull or push)
- Storage data - usually time series database (TSDB)
- Analysis / Reports
- Alert - alerting is not the only goal of monitoring
- Start monitoring from the users perspective. Create SLIs based on service usage by the end user. This is the most important metrics, all the web service metrics and infrastructure metrics come later and usually they are not used for alerting, only for troubleshooting.
- Buy, Not Build - always start with existed monitoring solution (buy some), and only if you outgrown this tool you could consider creating your own.
- Continual Improvement - don’t stop when you have something working.
- Test your monitoring system
Metrics
Types
- Business monitoring - how well we perform as a business.
- purchases per second (for e-commerce)
- views per second for blog / news
- Frontend Monitoring
- Can be done with sending logs from frontend
- Or by using Applicaiton Performance Monitor (APM)
- Application (backend) monitoring
- Requests
- Errors
- Duration
- Software (platform) monitoring
- databases
- container platform
- System monitoring (physical hosts)
- CPU
- Memory
- Disk IO
- Networking monitoring
Best Practices
- Every collected metric should have a purpose
- Worry about your tail
- Use the combination of whitebox and blackbox monitoring.
- with white box monitoring you could analyze the internal metrics for you application
- if the server is down or DNS is down you white box monitoring won’t see it.
- As simple as possible, no simpler
- the rules that catch real incidents most often should be as simple, predictable, and reliable as possible
- data collection, aggregation, and alertig configuration that is rarely exercised should be up for removal
- signals that are collected, but not exposed in any prebacked dashboard nor used by any alert, are candidates for removal
RED
Useful for online-serving systems (line REST API).
- Requests
- Errors
- Duration
- use percentiles
USE
Useful for ofline-servicing systems and batch jobs.
- Utilization - how full your service is
- Saturation - the amount of queued work
- Errors
The Four Golden Signals (google)
- Latency
- use percentiles
- Traffic
- Errors
- Saturation
- CPU
- Memory
- Disk IO
- Disk free size
- Open file descriptors / Connections
- Threads
- GoRoutines
- Queue size
Additional useful metrics
- Dependencies - you should always monitor your dependencies. So that, in case of emergency you could immediately understand that service dependency is the root cause of issue.
- the health of dependency
- availability, latency and errors for all requests to dependency.
- Intended Changes - changes is the number one source of any issues. It’s very useful to have all the change logs in one place. Type of changes:
- release of new software version
- configuration update
- infrastructure update
- hardware update
- External uptime checks.
- Blackbox monitoring.
- Number of alerts per service.
Metrics Examples
Virtual Machine
- CPU Usage
- Memory
- Disk Traffic
- Network Usage
- Clock Drift
Database Metrics
- Connections (threads in mysql)
- QPS
- Queries duration
- Replication lag
- IOPs
- Disk Usage
- The correctness of data
- to prevent the cases when we slowly loose data
Message Queues
- Queue Length
- Publish Rate
- Consumption rate
Cache
- Cache evicted ratio
- Cache hit ratio (hit / (hit + miss)
DNS
- Zone transfers (when slave sync with master)
- QPS
- at least QPS for server
- better QPS per zone
- the best QPS per view
Visualization
- Stack related graphs vertically.
- Use the correct (and expected) scale and unit in your axes.
- Add thresholds to graphs when relevant.
- Enable shared crosshairs across graphs (possible in grafana).
In Real Life
-
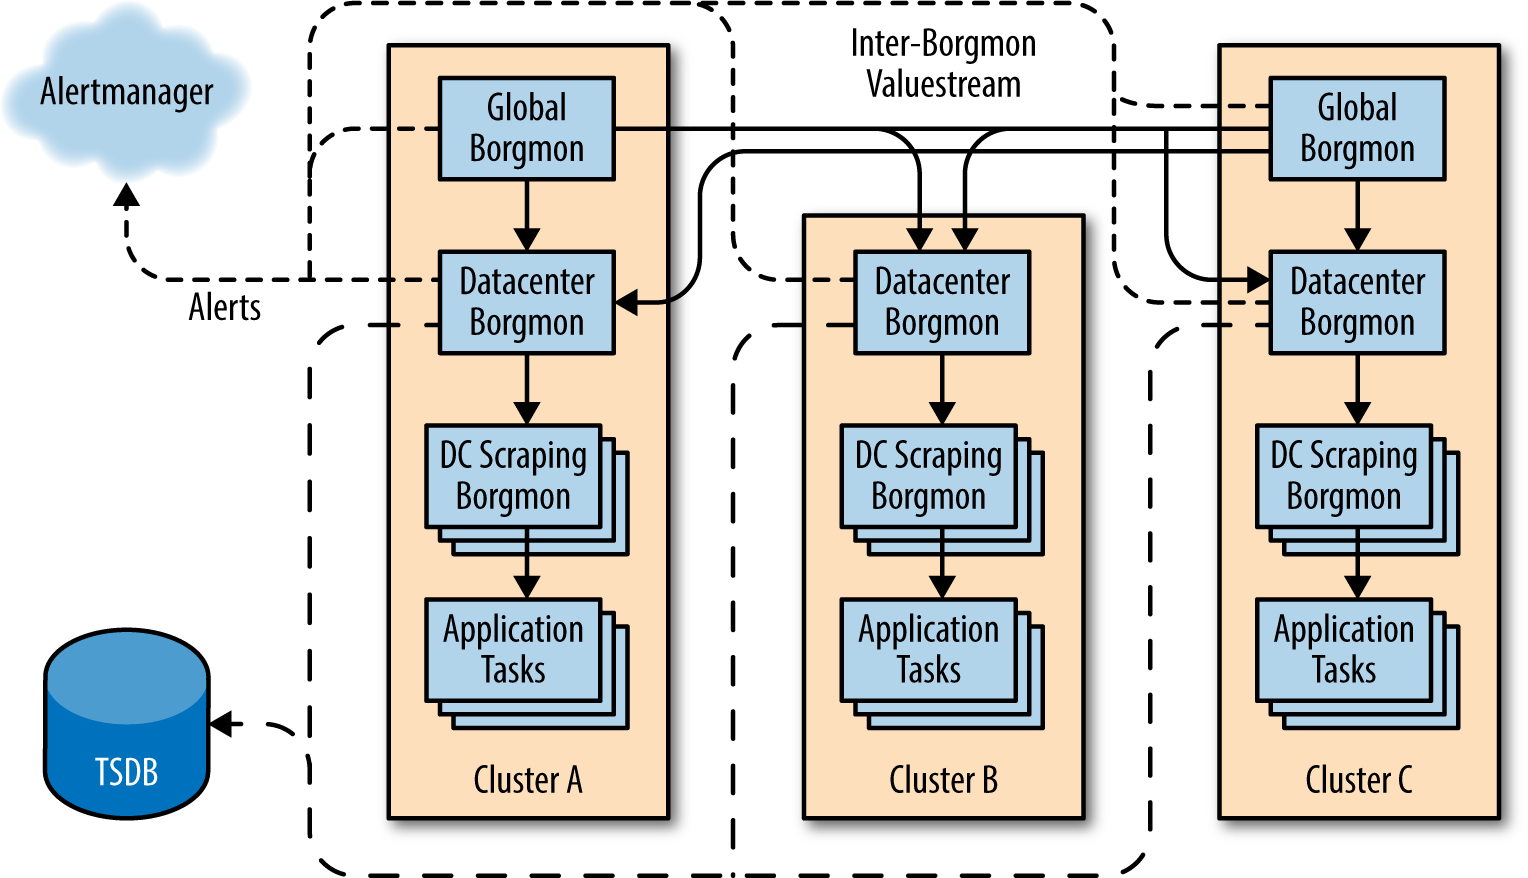
Google Monitoring
